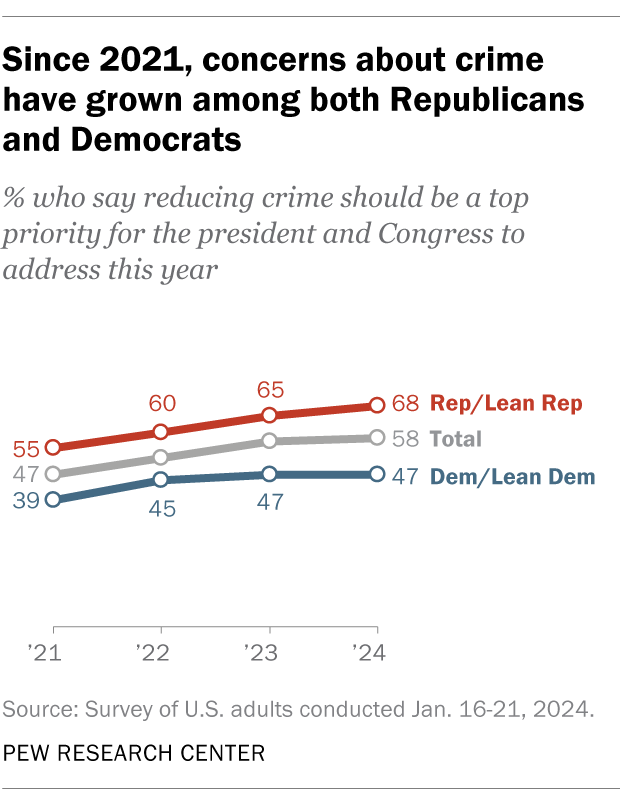
A growing share of Americans say reducing crime should be a top priority for the president and Congress to address this year. Around six-in-ten U.S. adults (58%) hold that view today, up from 47% at the beginning of Joe Biden’s presidency in 2021.
We conducted this analysis to learn more about U.S. crime patterns and how those patterns have changed over time.
The analysis relies on statistics published by the FBI, which we accessed through the Crime Data Explorer, and the Bureau of Justice Statistics (BJS), which we accessed through the National Crime Victimization Survey data analysis tool.
To measure public attitudes about crime in the U.S., we relied on survey data from Pew Research Center and Gallup.
Additional details about each data source, including survey methodologies, are available by following the links in the text of this analysis.
With the issue likely to come up in this year’s presidential election, here’s what we know about crime in the United States, based on the latest available data from the federal government and other sources.
How much crime is there in the U.S.?
It’s difficult to say for certain. The two primary sources of government crime statistics – the Federal Bureau of Investigation (FBI) and the Bureau of Justice Statistics (BJS) – paint an incomplete picture.
The FBI publishes annual data on crimes that have been reported to law enforcement, but not crimes that haven’t been reported. Historically, the FBI has also only published statistics about a handful of specific violent and property crimes, but not many other types of crime, such as drug crime. And while the FBI’s data is based on information from thousands of federal, state, county, city and other police departments, not all law enforcement agencies participate every year. In 2022, the most recent full year with available statistics, the FBI received data from 83% of participating agencies.
BJS, for its part, tracks crime by fielding a large annual survey of Americans ages 12 and older and asking them whether they were the victim of certain types of crime in the past six months. One advantage of this approach is that it captures both reported and unreported crimes. But the BJS survey has limitations of its own. Like the FBI, it focuses mainly on a handful of violent and property crimes. And since the BJS data is based on after-the-fact interviews with crime victims, it cannot provide information about one especially high-profile type of offense: murder.
All those caveats aside, looking at the FBI and BJS statistics side-by-side does give researchers a good picture of U.S. violent and property crime rates and how they have changed over time. In addition, the FBI is transitioning to a new data collection system – known as the National Incident-Based Reporting System – that eventually will provide national information on a much larger set of crimes, as well as details such as the time and place they occur and the types of weapons involved, if applicable.
Which kinds of crime are most and least common?
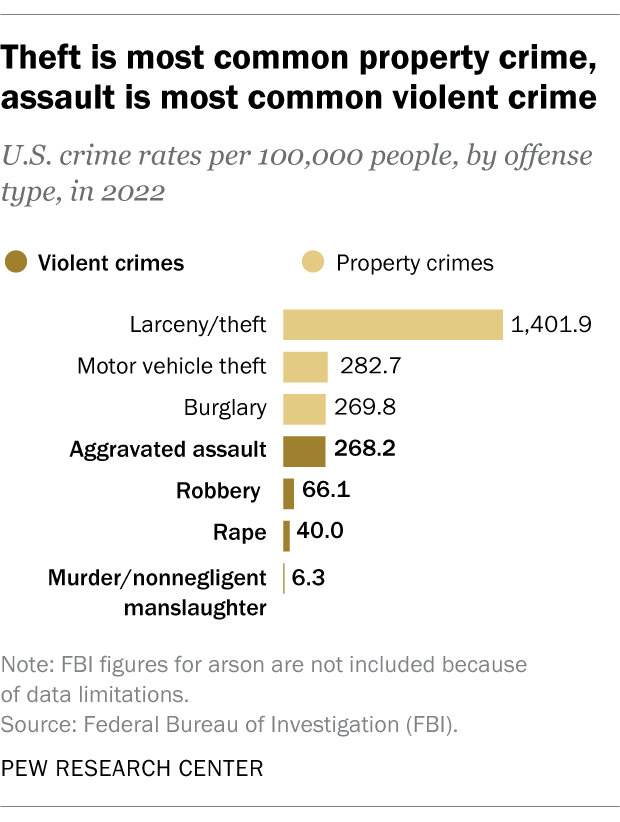
Property crime in the U.S. is much more common than violent crime. In 2022, the FBI reported a total of 1,954.4 property crimes per 100,000 people, compared with 380.7 violent crimes per 100,000 people.
By far the most common form of property crime in 2022 was larceny/theft, followed by motor vehicle theft and burglary. Among violent crimes, aggravated assault was the most common offense, followed by robbery, rape, and murder/nonnegligent manslaughter.
BJS tracks a slightly different set of offenses from the FBI, but it finds the same overall patterns, with theft the most common form of property crime in 2022 and assault the most common form of violent crime.
How have crime rates in the U.S. changed over time?
Both the FBI and BJS data show dramatic declines in U.S. violent and property crime rates since the early 1990s, when crime spiked across much of the nation.
Using the FBI data, the violent crime rate fell 49% between 1993 and 2022, with large decreases in the rates of robbery (-74%), aggravated assault (-39%) and murder/nonnegligent manslaughter (-34%). It’s not possible to calculate the change in the rape rate during this period because the FBI revised its definition of the offense in 2013.
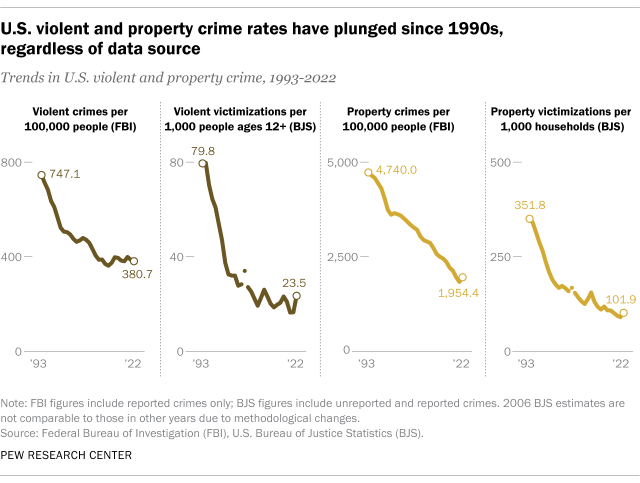
The FBI data also shows a 59% reduction in the U.S. property crime rate between 1993 and 2022, with big declines in the rates of burglary (-75%), larceny/theft (-54%) and motor vehicle theft (-53%).
Using the BJS statistics, the declines in the violent and property crime rates are even steeper than those captured in the FBI data. Per BJS, the U.S. violent and property crime rates each fell 71% between 1993 and 2022.
While crime rates have fallen sharply over the long term, the decline hasn’t always been steady. There have been notable increases in certain kinds of crime in some years, including recently.
In 2020, for example, the U.S. murder rate saw its largest single-year increase on record – and by 2022, it remained considerably higher than before the coronavirus pandemic. Preliminary data for 2023, however, suggests that the murder rate fell substantially last year.
How do Americans perceive crime in their country?
Americans tend to believe crime is up, even when official data shows it is down.
In 23 of 27 Gallup surveys conducted since 1993, at least 60% of U.S. adults have said there is more crime nationally than there was the year before, despite the downward trend in crime rates during most of that period.
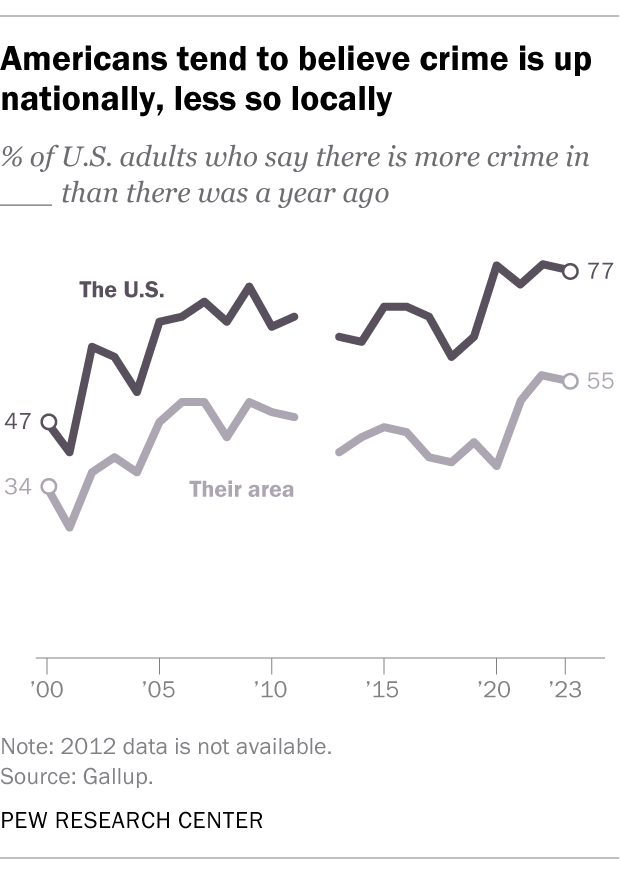
While perceptions of rising crime at the national level are common, fewer Americans believe crime is up in their own communities. In every Gallup crime survey since the 1990s, Americans have been much less likely to say crime is up in their area than to say the same about crime nationally.
Public attitudes about crime differ widely by Americans’ party affiliation, race and ethnicity, and other factors. For example, Republicans and Republican-leaning independents are much more likely than Democrats and Democratic leaners to say reducing crime should be a top priority for the president and Congress this year (68% vs. 47%), according to a recent Pew Research Center survey.
How does crime in the U.S. differ by demographic characteristics?
Some groups of Americans are more likely than others to be victims of crime. In the 2022 BJS survey, for example, younger people and those with lower incomes were far more likely to report being the victim of a violent crime than older and higher-income people.
There were no major differences in violent crime victimization rates between male and female respondents or between those who identified as White, Black or Hispanic. But the victimization rate among Asian Americans (a category that includes Native Hawaiians and other Pacific Islanders) was substantially lower than among other racial and ethnic groups.
The same BJS survey asks victims about the demographic characteristics of the offenders in the incidents they experienced.
In 2022, those who are male, younger people and those who are Black accounted for considerably larger shares of perceived offenders in violent incidents than their respective shares of the U.S. population. Men, for instance, accounted for 79% of perceived offenders in violent incidents, compared with 49% of the nation’s 12-and-older population that year. Black Americans accounted for 25% of perceived offenders in violent incidents, about twice their share of the 12-and-older population (12%).
As with all surveys, however, there are several potential sources of error, including the possibility that crime victims’ perceptions about offenders are incorrect.
How does crime in the U.S. differ geographically?
There are big geographic differences in violent and property crime rates.
For example, in 2022, there were more than 700 violent crimes per 100,000 residents in New Mexico and Alaska. That compares with fewer than 200 per 100,000 people in Rhode Island, Connecticut, New Hampshire and Maine, according to the FBI.
The FBI notes that various factors might influence an area’s crime rate, including its population density and economic conditions.
What percentage of crimes are reported to police? What percentage are solved?
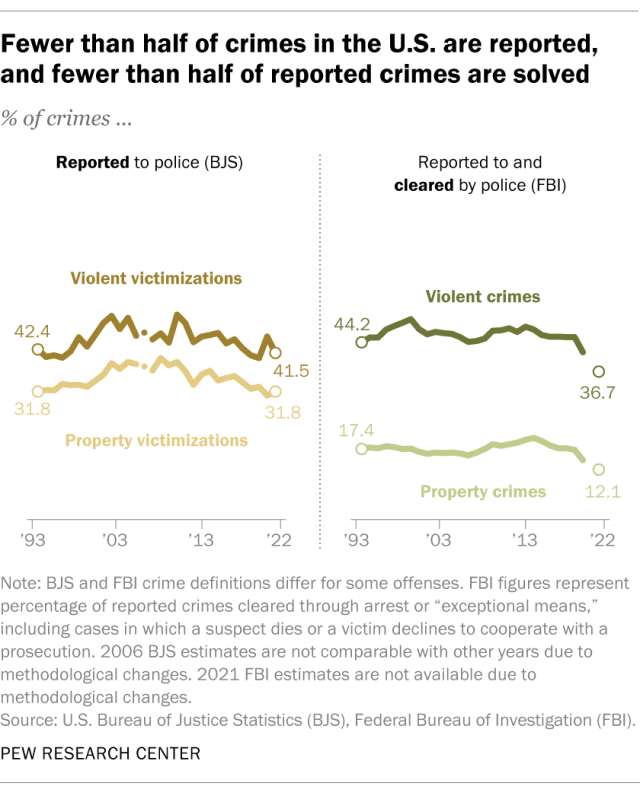
Most violent and property crimes in the U.S. are not reported to police, and most of the crimes that are reported are not solved.
In its annual survey, BJS asks crime victims whether they reported their crime to police. It found that in 2022, only 41.5% of violent crimes and 31.8% of household property crimes were reported to authorities. BJS notes that there are many reasons why crime might not be reported, including fear of reprisal or of “getting the offender in trouble,” a feeling that police “would not or could not do anything to help,” or a belief that the crime is “a personal issue or too trivial to report.”
Most of the crimes that are reported to police, meanwhile, are not solved, at least based on an FBI measure known as the clearance rate. That’s the share of cases each year that are closed, or “cleared,” through the arrest, charging and referral of a suspect for prosecution, or due to “exceptional” circumstances such as the death of a suspect or a victim’s refusal to cooperate with a prosecution. In 2022, police nationwide cleared 36.7% of violent crimes that were reported to them and 12.1% of the property crimes that came to their attention.
Which crimes are most likely to be reported to police? Which are most likely to be solved?
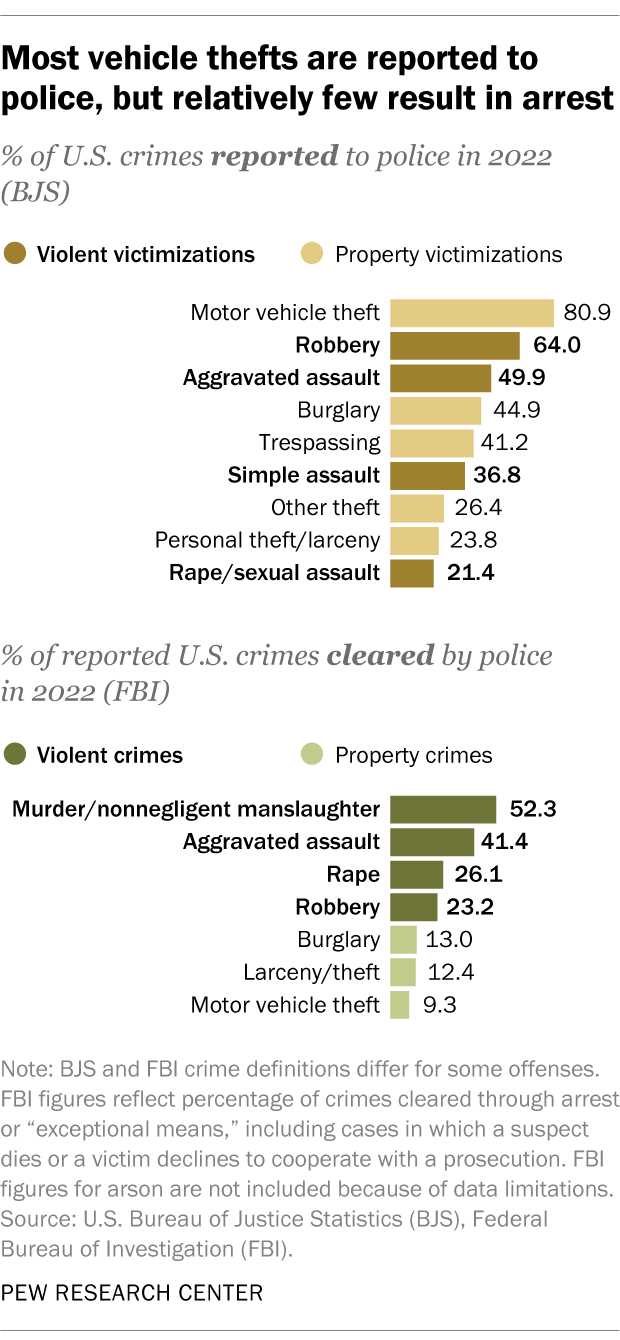
Around eight-in-ten motor vehicle thefts (80.9%) were reported to police in 2022, making them by far the most commonly reported property crime tracked by BJS. Household burglaries and trespassing offenses were reported to police at much lower rates (44.9% and 41.2%, respectively), while personal theft/larceny and other types of theft were only reported around a quarter of the time.
Among violent crimes – excluding homicide, which BJS doesn’t track – robbery was the most likely to be reported to law enforcement in 2022 (64.0%). It was followed by aggravated assault (49.9%), simple assault (36.8%) and rape/sexual assault (21.4%).
The list of crimes cleared by police in 2022 looks different from the list of crimes reported. Law enforcement officers were generally much more likely to solve violent crimes than property crimes, according to the FBI.
The most frequently solved violent crime tends to be homicide. Police cleared around half of murders and nonnegligent manslaughters (52.3%) in 2022. The clearance rates were lower for aggravated assault (41.4%), rape (26.1%) and robbery (23.2%).
When it comes to property crime, law enforcement agencies cleared 13.0% of burglaries, 12.4% of larcenies/thefts and 9.3% of motor vehicle thefts in 2022.
Are police solving more or fewer crimes than they used to?
Nationwide clearance rates for both violent and property crime are at their lowest levels since at least 1993, the FBI data shows.
Police cleared a little over a third (36.7%) of the violent crimes that came to their attention in 2022, down from nearly half (48.1%) as recently as 2013. During the same period, there were decreases for each of the four types of violent crime the FBI tracks:
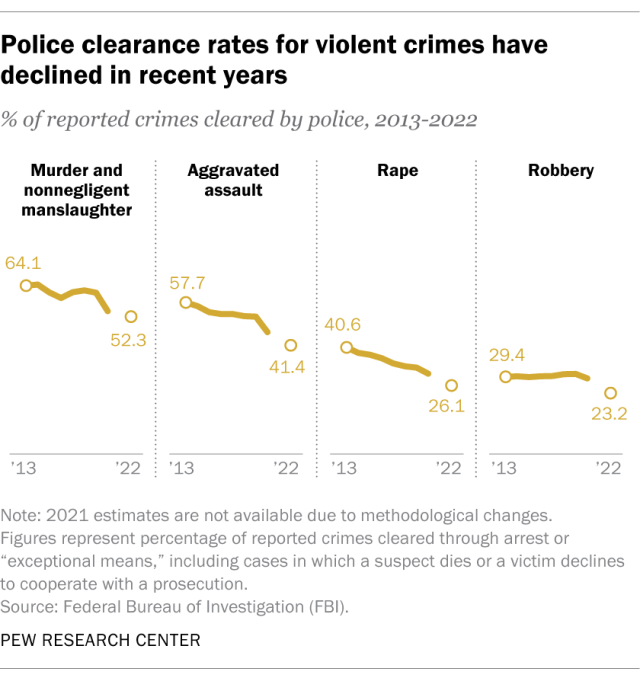
- Police cleared 52.3% of reported murders and nonnegligent homicides in 2022, down from 64.1% in 2013.
- They cleared 41.4% of aggravated assaults, down from 57.7%.
- They cleared 26.1% of rapes, down from 40.6%.
- They cleared 23.2% of robberies, down from 29.4%.
The pattern is less pronounced for property crime. Overall, law enforcement agencies cleared 12.1% of reported property crimes in 2022, down from 19.7% in 2013. The clearance rate for burglary didn’t change much, but it fell for larceny/theft (to 12.4% in 2022 from 22.4% in 2013) and motor vehicle theft (to 9.3% from 14.2%).
Note: This is an update of a post originally published on Nov. 20, 2020.
