580 California St., Suite 400
San Francisco, CA, 94104
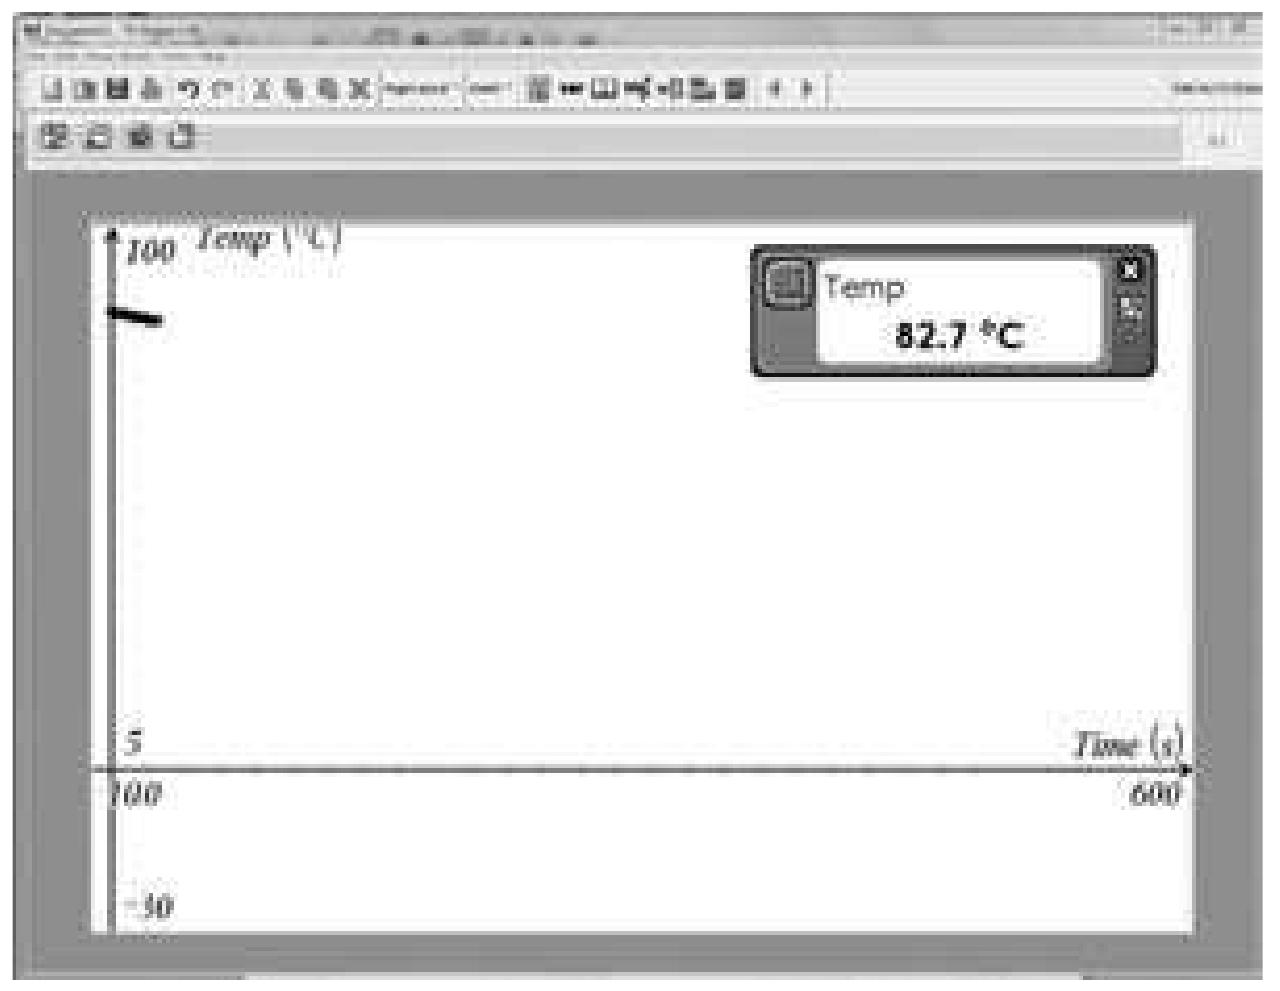
Figure 32 predict the temperature at the end of the Ist minute. The experiment is timed (we used a volunteer timekeeper to shout out 5-4-3-2-1 at the end of each minute). At the end of the 1st minute, the actual temperature is logged on the worksheet and a prediction is made for the end of the 2nd minute. Now, some students start to look at the rate of cooling as an indicator to sup- port their estimate for the end of the 2nd minute. Also, students are asked to estimate the temperature at the end of the 5th minute. The experiment continues in this way for 10 minutes, each time students make future esti- mates. After 5 minutes they estimate for end of the 6th minute and the end of the 10th minute. By now, students are taking close account of the rate of change and using this to make better and better estimates for each succes- sive minute. There is an aura of quiet competitiveness and satisfaction when estimates are close or even perfect. (Reading are taken to one decimal place). After 10 minutes, they estimate for 30 minutes, 120 minutes and 24 hours. Again the requirement to explain the basis for the estimation is emphasized. This last part requires students to share their mechanisms for estimation and discuss how they expect the temperature to change after the experiment has ended, that is, into the never-to-be-known. It was gratifying that students happily watched a pizza warming in a microwave oven for 2 minutes then watched it cooling for 10 with rapt attention!


![FiGuRE 27.1 [DCH2(tns-T) Page 2]](https://figures.academia-assets.com/38815539/figure_070.jpg)


