Figure 2 – uploaded by Steven Pinker

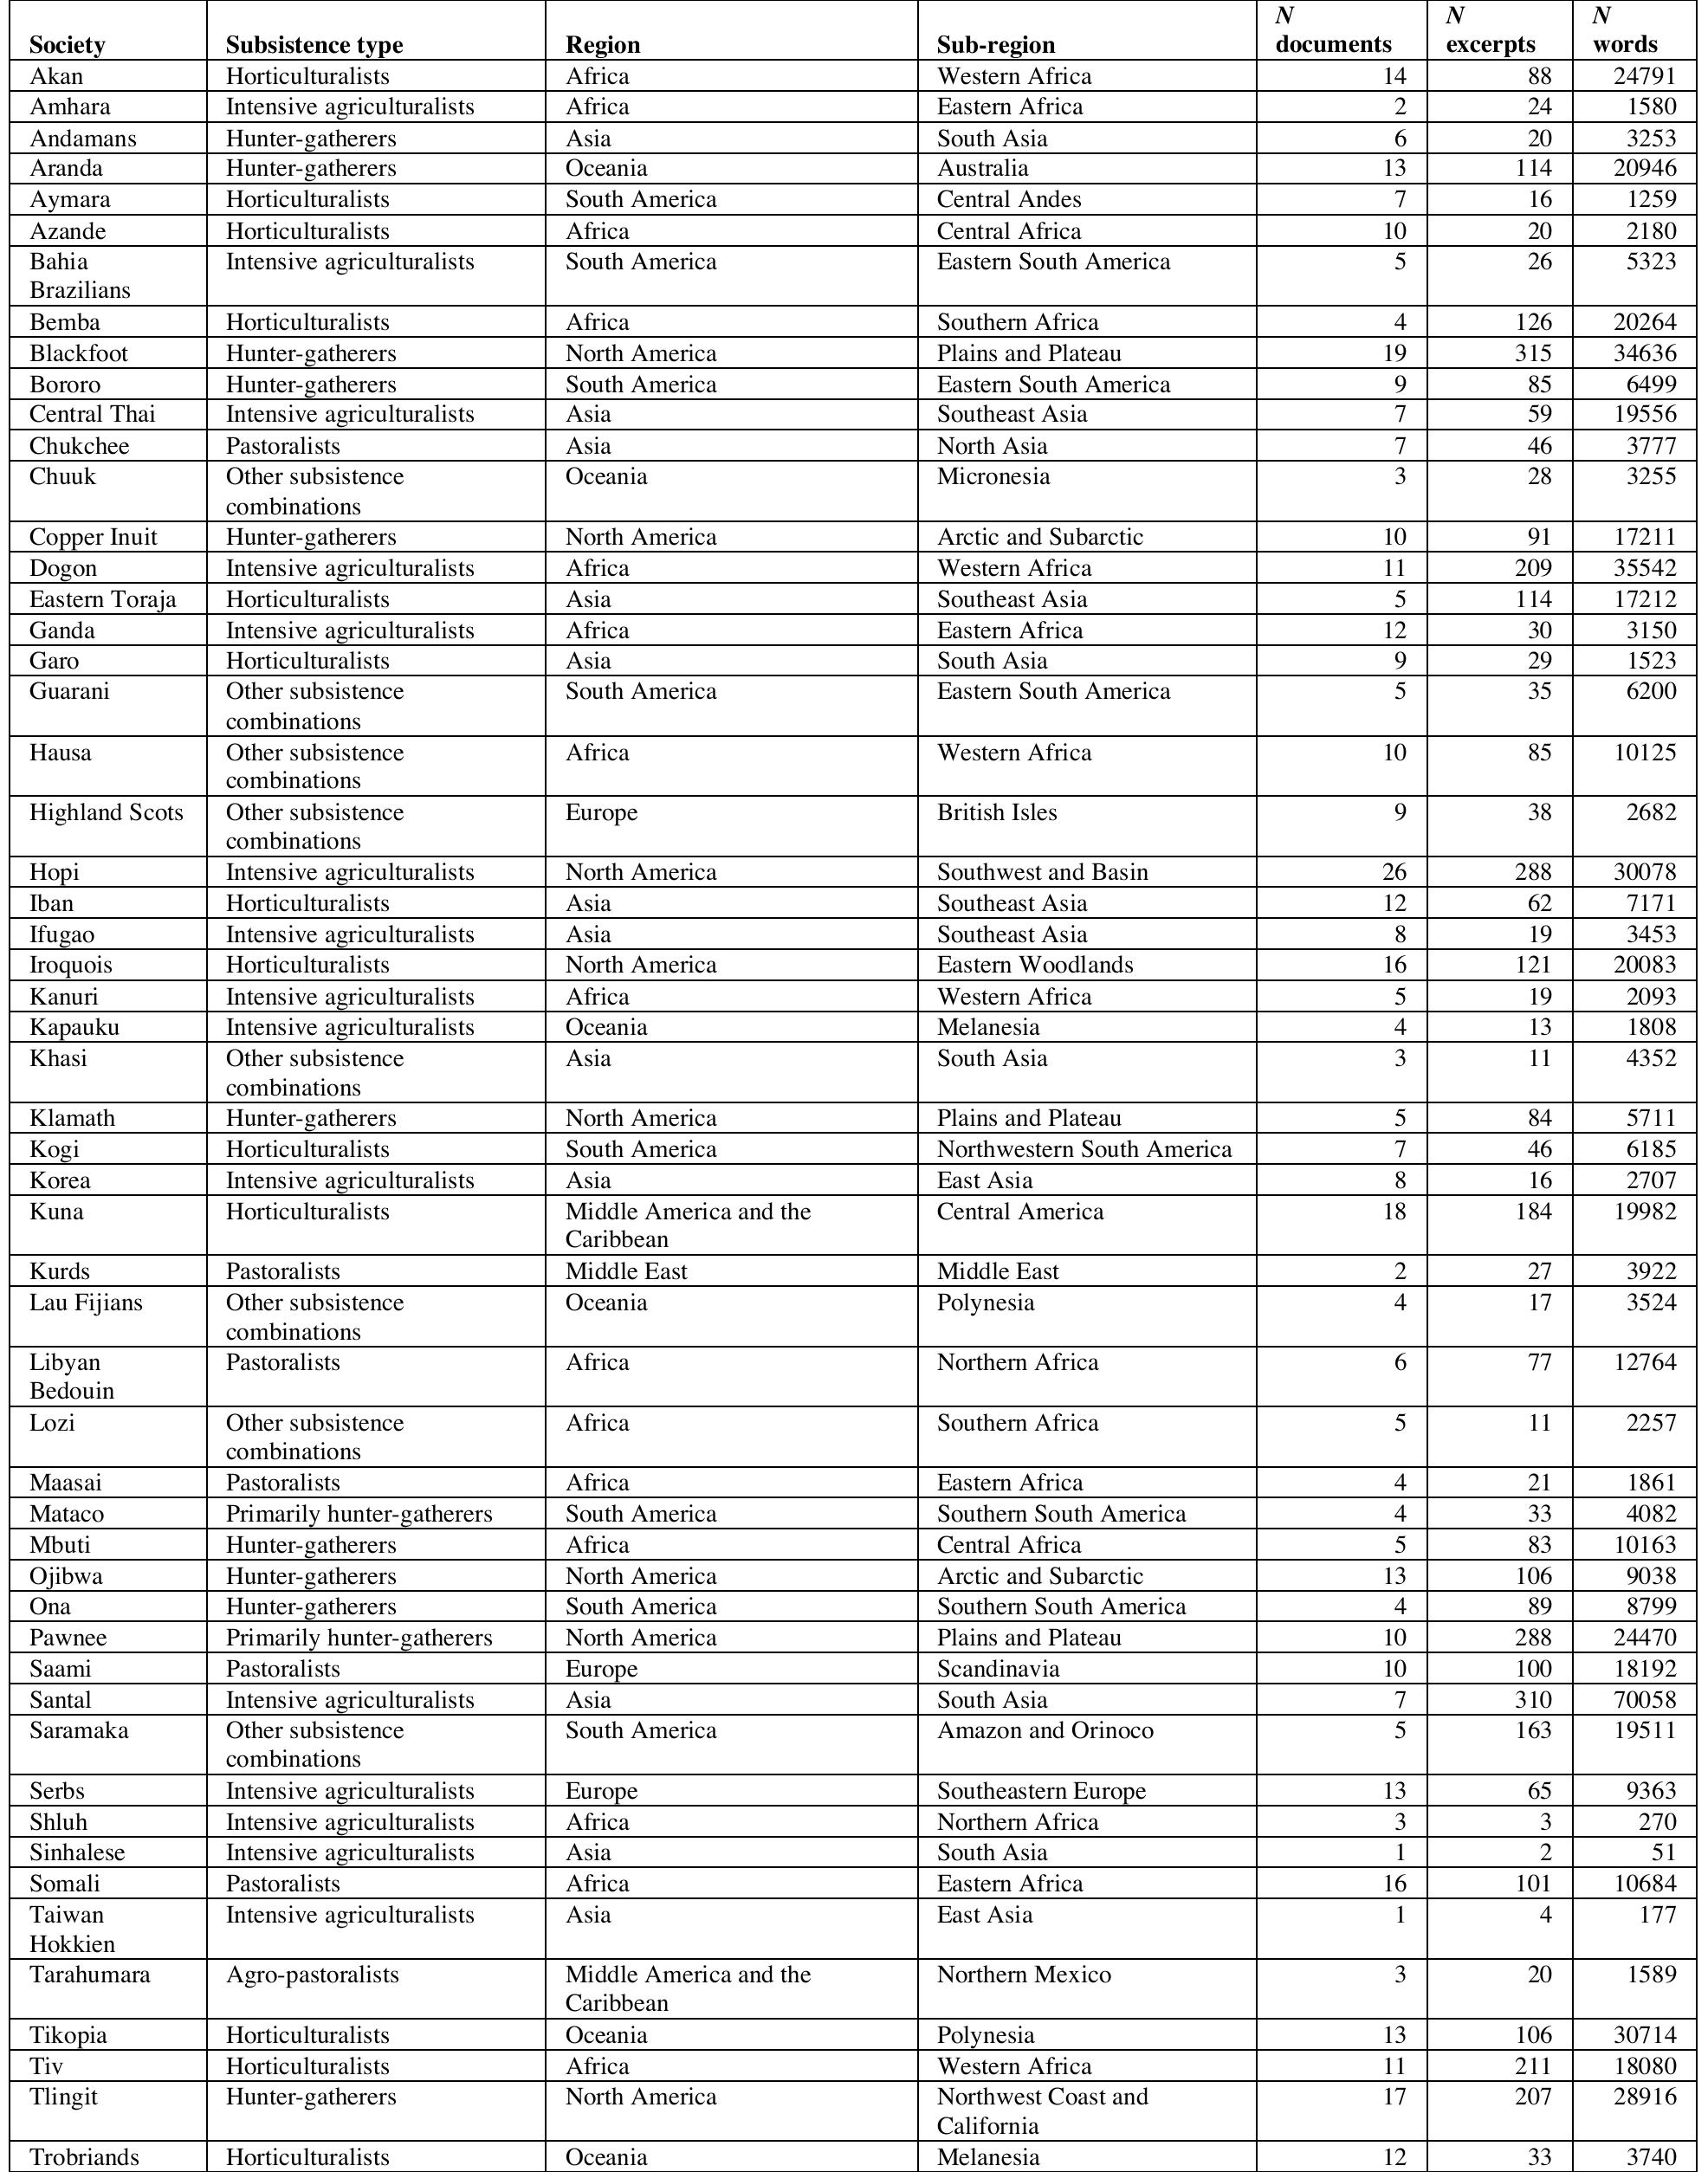
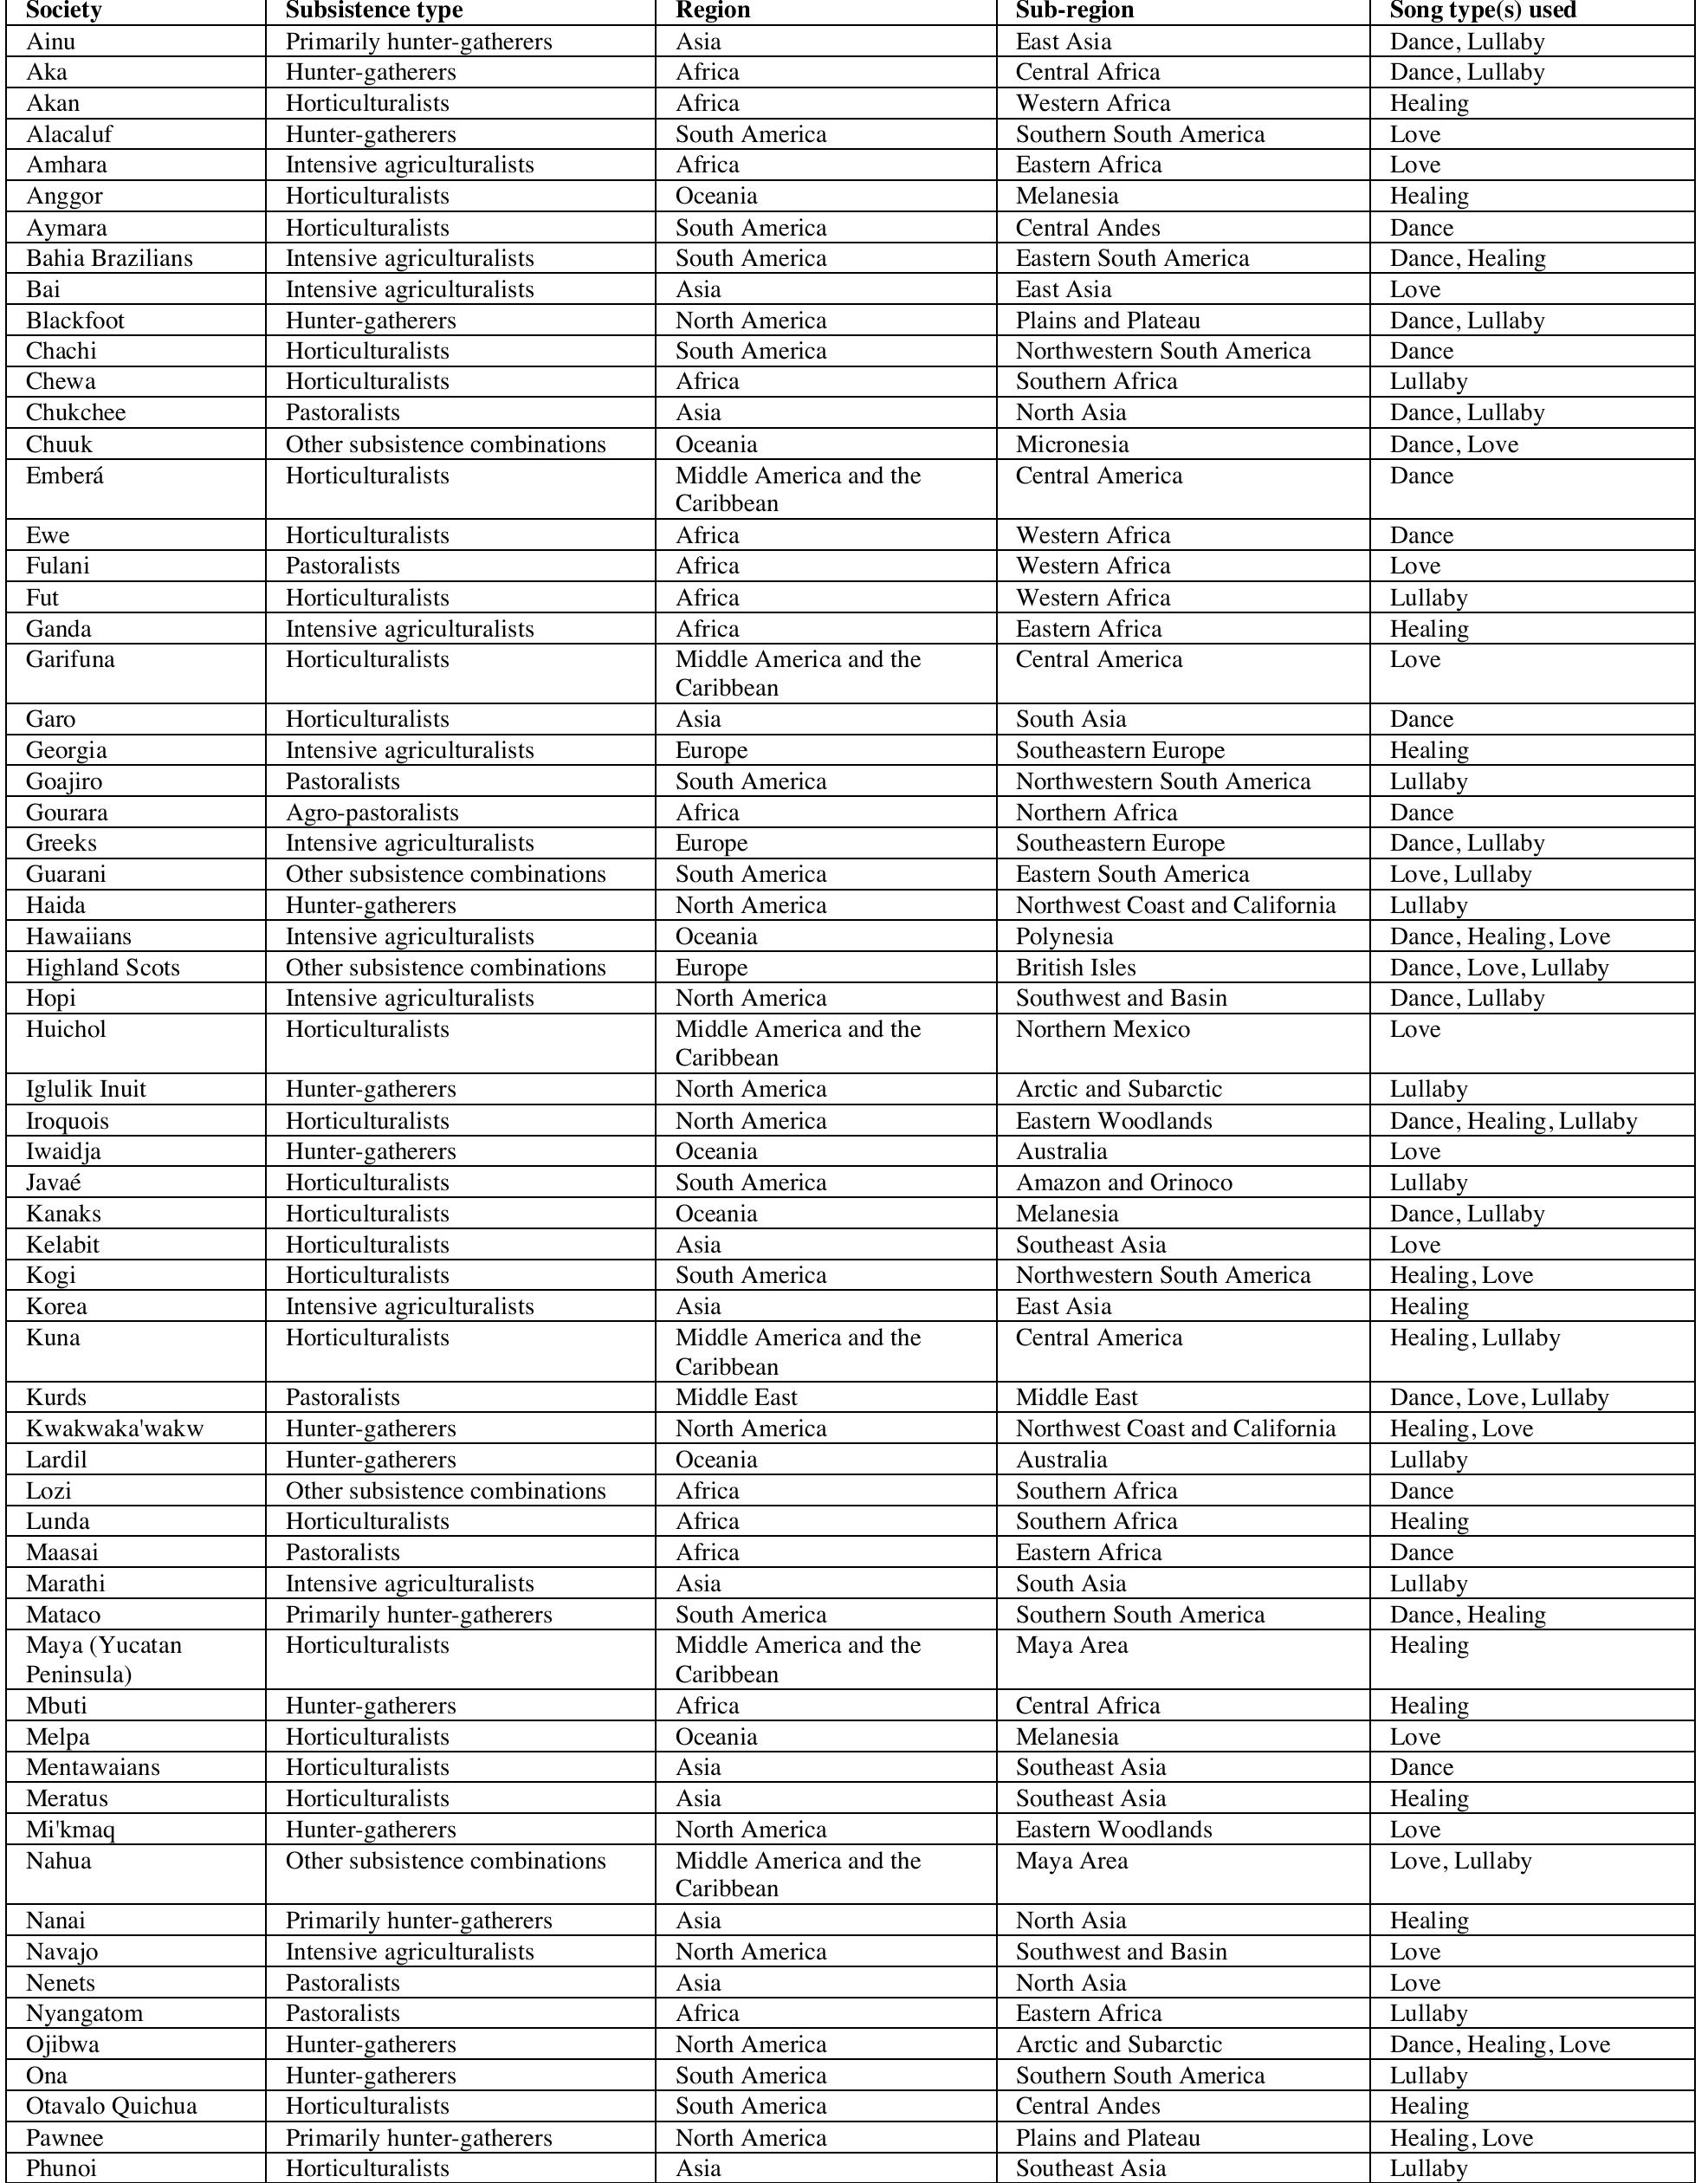
Figure 2 Patterns of variation in the NHS Ethnography. The figure depicts a projection of a subset of the NHS Ethnography onto three principal components (A). Each point represents the of an excerpt, with points colored by which of four types (identified by a broad search presented here (highlighted circles and B, C, D, E). Density plots (F, G, H) show song types on each dimension. Criteria for classifying song types from the raw tex presented in Table $17. he d posterior mean location for matching keywords and annotations) it falls into: dance (blue), lullaby (green), healing (red), or love (yellow). The geometric centroids of each song type are represented by the diamonds. Excerpts that d single search are not plotted, but can be viewed in the interactive version of this figure http://themusiclab.org/nhsplots, along with all text and metadata. Selected examples of 0 not match any at each song type are ifferences between and annotations are
Related Figures (81)


Connect with 287M+ leading minds in your field
Discover breakthrough research and expand your academic network
Join for free
