Version 1.107 is now available! Read about the new features and fixes from November.
Dismiss this update
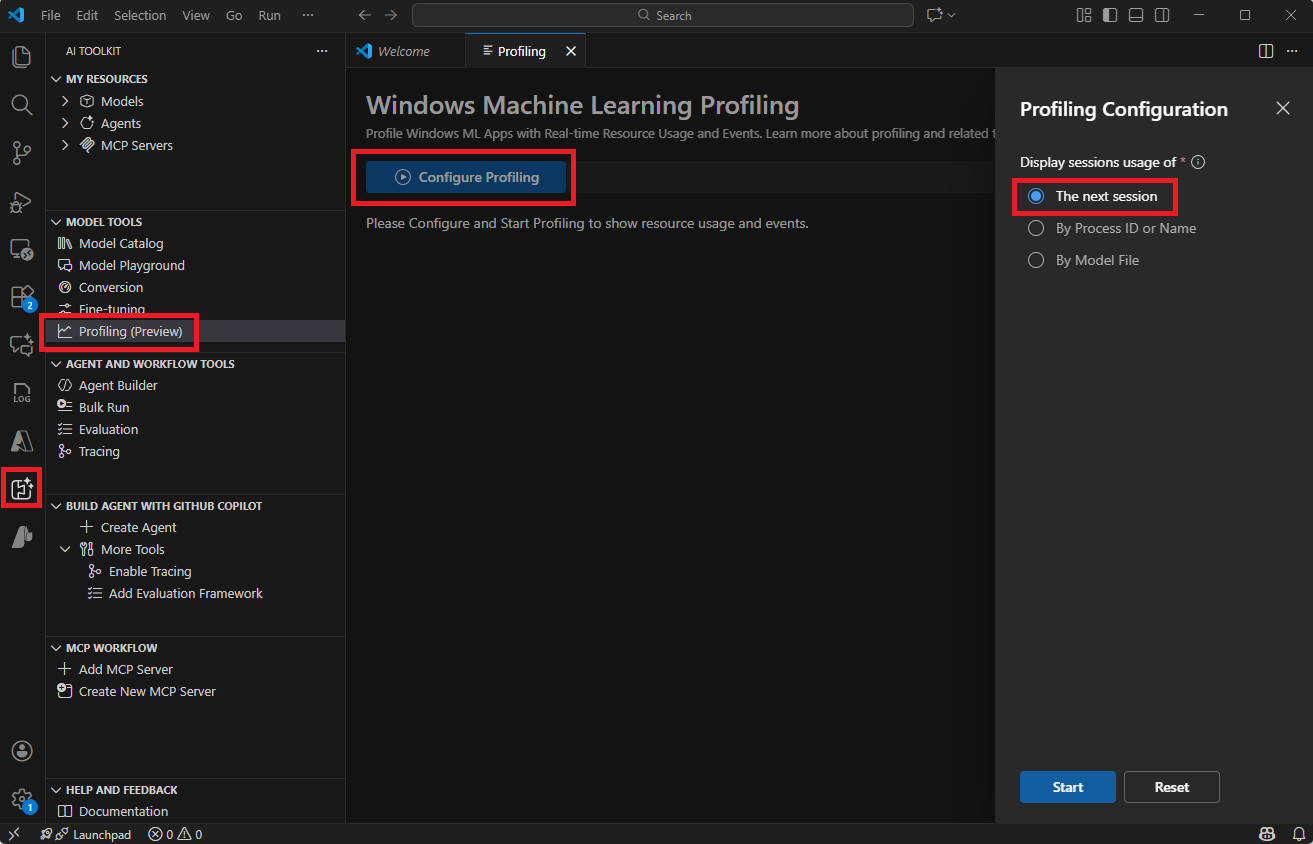
Profiling is a tool designed to help developers and AI engineers to diagnose the CPU, GPU, NPU resource usages of processes, ONNX model on different execution providers, and Windows ML events.
In this article, you could learn how to start profiling and how to inspect the resource usages view and the events view.
In this mode, the profiling tool profiles the next app that is started and that is sending out Windows ML events. This option is ideal for testing a run-once app. In this case, you start profiling, then run the app, and the resource usages will begin showing up.
The tool starts profiling a newly started app. This means that for profiling a Python notebook, if the kernel is already running, you need to restart the kernel to begin profiling for it. Just starting a new notebook does not automatically start profiling.
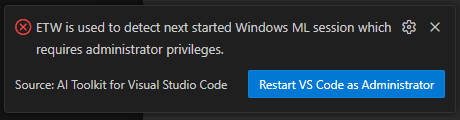
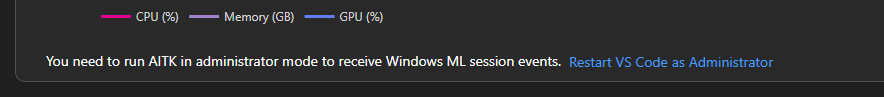
To receive Windows ML events, the tool needs to be run in admin mode. If VS Code is not started in admin mode, a notification shows up and guides you to restart VS Code. You need to close all other VS Code instances to make the restart in admin mode work.
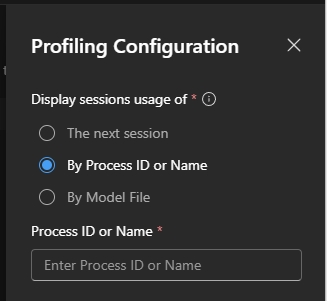
In this mode, the profiling tool starts profiling an already running app. You can select a process based on these criteria:
.exe. The first match will be profiled.c:\Users\xxx\Inference.Service.Agent.exe. The first match will be profiled.This option is ideal for profiling an app that is already running and you're unable to restart it for profiling purposes.
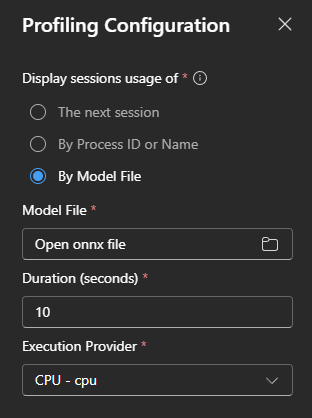
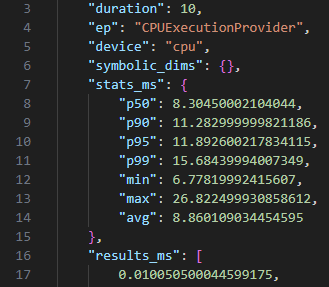
In this mode, the profiling tool starts profiling an ONNX model file on a target execution provider (EP) for a given duration. You can see the resource usage while it's running.
This option is ideal for profiling an ONNX model on different EPs.
After profiling, a report folder is created with logs and data.
In the main window, the plot on the top shows usage of CPU, GPU, NPU, and memory. The usage is updated every second, and kept for 10 minutes. You can use the tools on the top right to navigate the timeline by zooming in, zooming out, and panning.
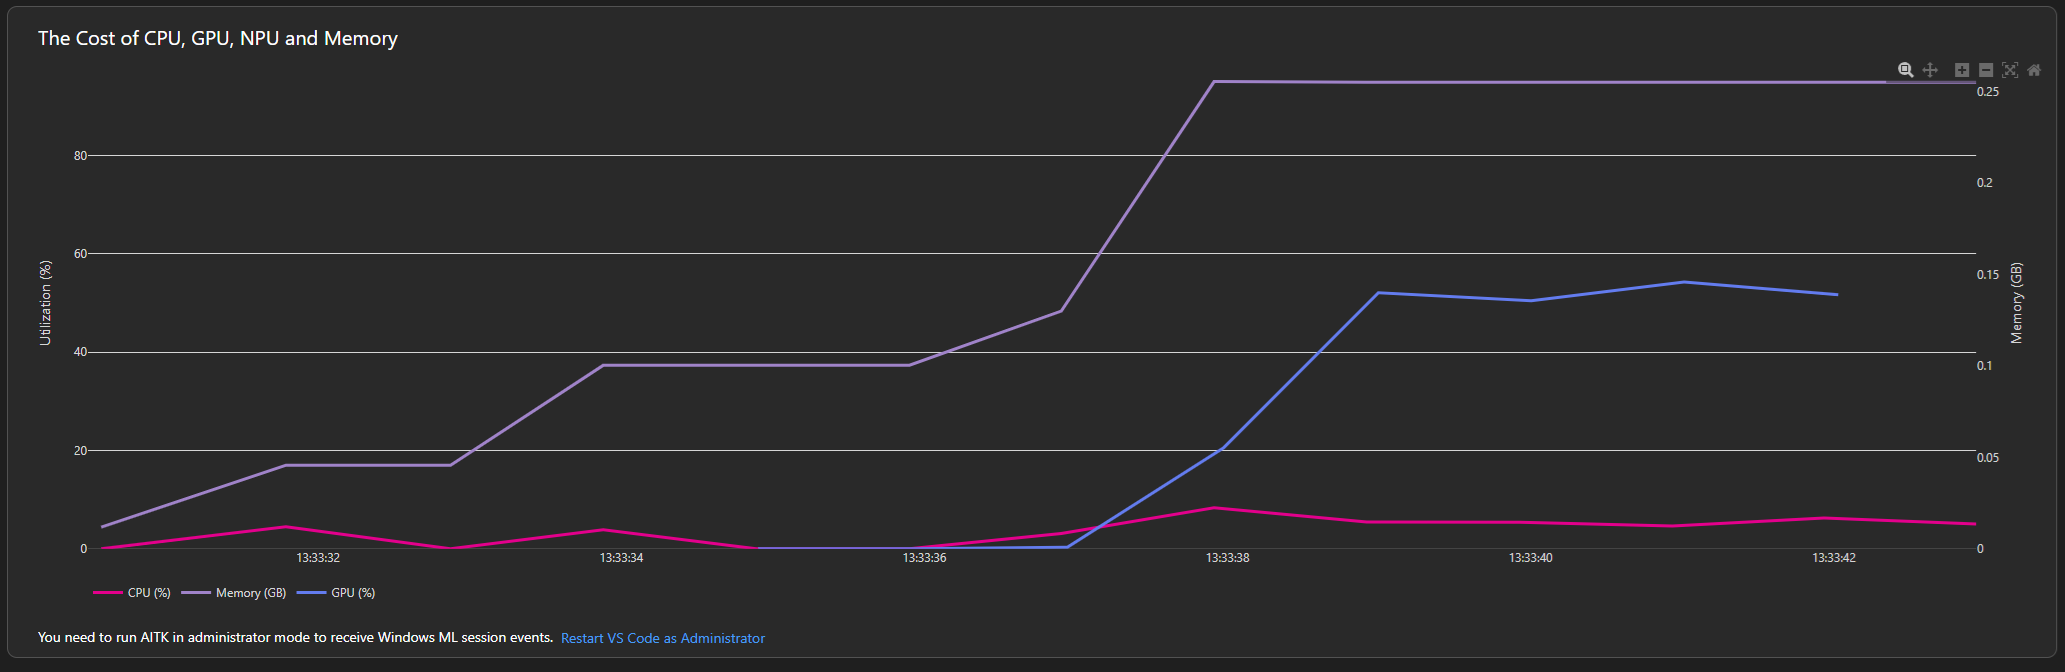
This feature uses performance counters. To achieve higher accuracy, you could also try Windows Performance Recorder.
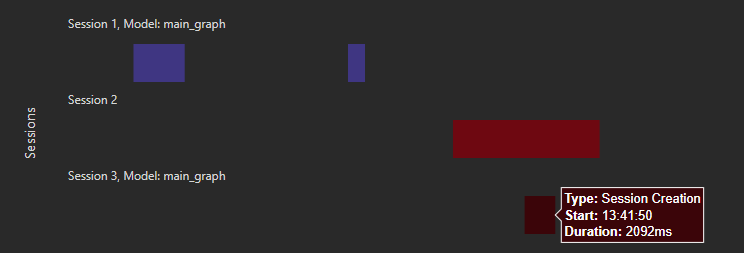
In the main window, the plot on the bottom shows Windows ML events. Its timeline is synced with the Resource Usages view, so you can easily determine how resources are used when certain events occur.
To receive Windows ML events, the tool needs to be run in admin mode. If VS Code is not started in admin mode, a notification shows up and guides you to restart VS Code. You need to close all other VS Code instances to make the restart in admin mode work.
Currently, we only show events of the following types:
In this article, you learned how to: