Patent Litigation
District Court
In the third quarter of 2016, plaintiffs filed 1,127 patent cases. This total represents an decrease over Q2 (1,289 cases) of 12.6%, but is still higher than the Q1 2016 (960 cases).
Looking at the months in the second second quarter more closely (Fig. 2), September (310 cases) was slower than both July (416 cases) and August (401 cases). Relative to the first three quarters of previous years, 2016 looks to be the slowest year since 2011 (Fig. 3).
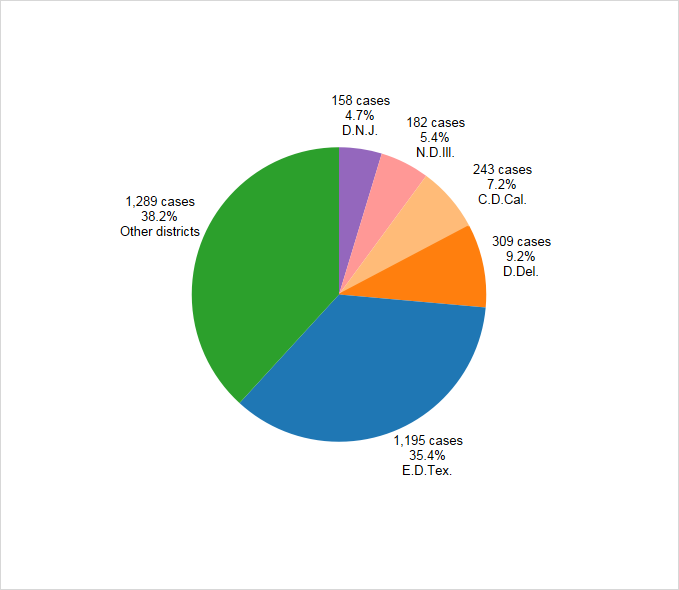
The proportion of total new filings made in the Eastern District of Texas held nearly steady in Q3 at 35.4% – down slightly from 37% in the second quarter but up from the first quarter (30%) (Fig. 5). In 2015, for comparison, the district had 43% of the patent cases filed.
Fig. 1: Patent cases filed, 2011 – 2016 Q3, by quarter
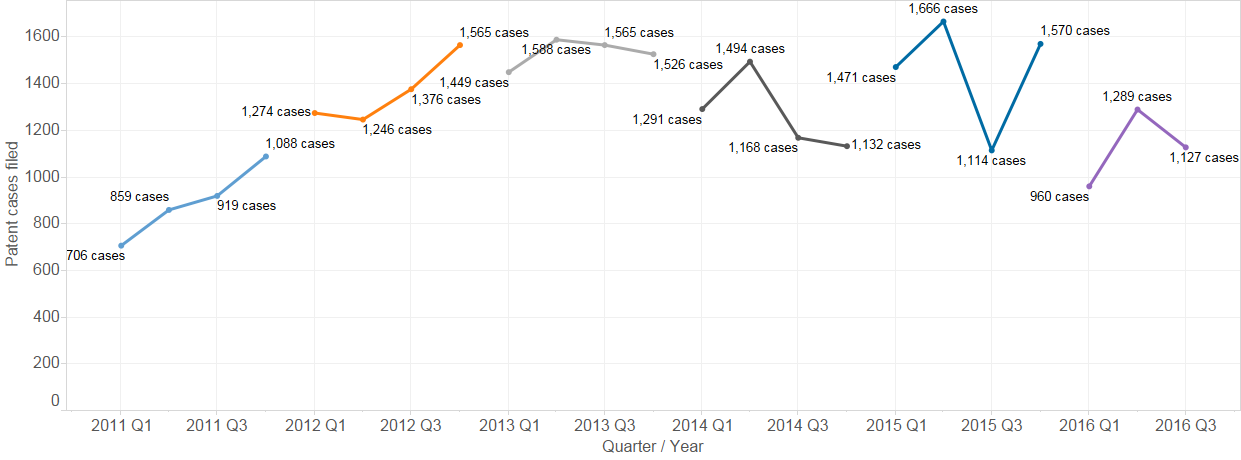
Fig. 2: Patent cases filed, 2014 – 2016 Q3, by month
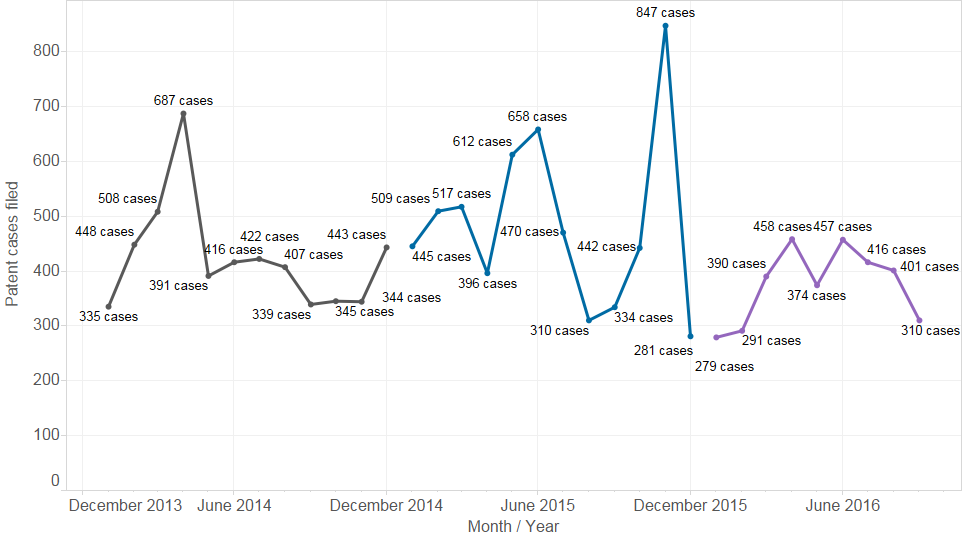
Fig. 3: Patent cases filed, 2011-2016, Q1-Q3 only, by year
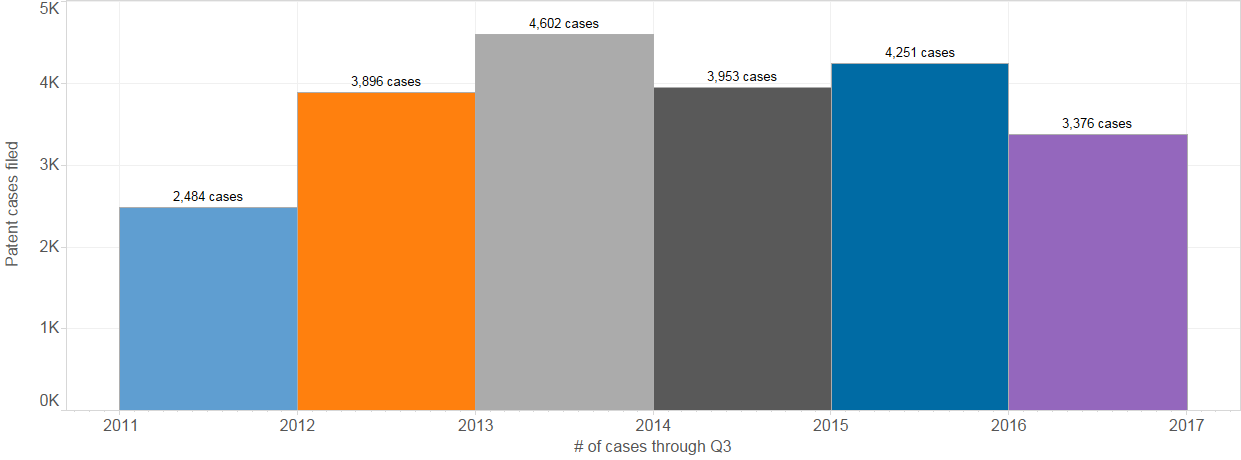
Fig. 4: Top districts by patent cases filed, 2011-2016 Q3

Fig. 5: Top districts by patent cases filed, 2016 Q1-Q3
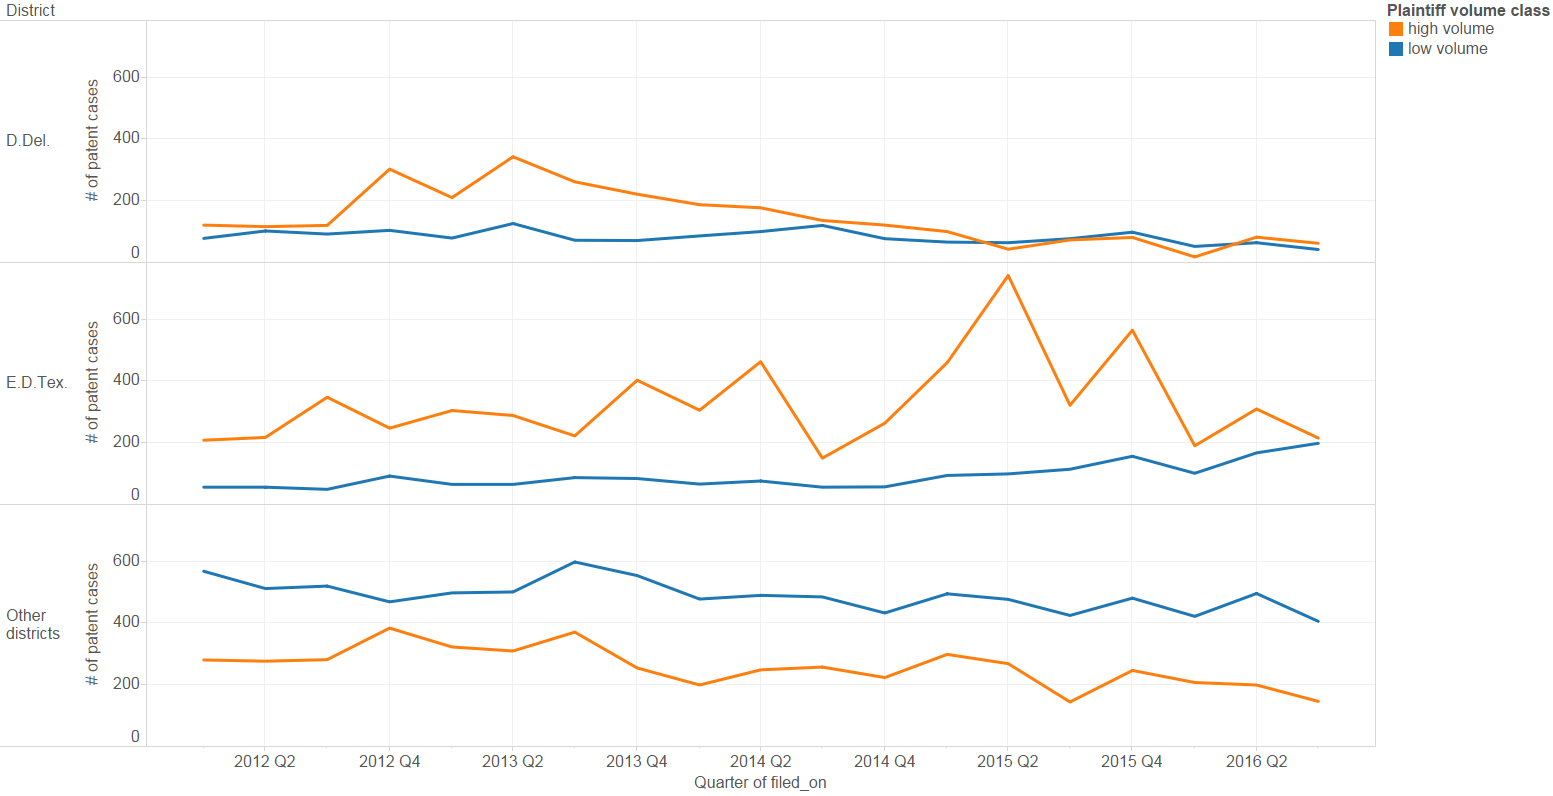
To gain more insight into patent litigation, cases can be broken down according to whether the plaintiff* has filed at least 10 other cases within a 365 day span (high volume) or not (low volume). This simple behavioral measure reveals that patent litigation in the Eastern District of Texas and in the District of Delaware differs starkly from litigation in other districts: a far higher percentage of E.D.Tex. and D.Del. litigation is from high volume plaintiffs.
Moreover, in those two districts, high volume plaintiffs drive most of the volatility in case filings, both in time (i.e. spikes and dips within Eastern Texas) and between districts (i.e. Delaware’s decline corresponds to the rise in Eastern Texas). In contrast, litigation by low volume plaintiffs is relatively consistent across time and districts.
* or more precisely, whether a plaintiff (or declaratory judgement defendant) has filed (or been subject to a declaratory judgment case) in at least 10 other cases within 365 days. Although the values of 10 and 365 are somewhat arbitrary, the conclusions hold for a range of these values.
Fig. 6: Plaintiff volume class, 2011-2016 Q3
The Patent Trial and Appeal Board
New filings of Covered Business Method (CBM) reviews by quarter have declined to single digits for the first time since 2013, but the number of Inter Partes Review (IPR) petitions at PTAB has recovered from a low first quarter (335) petitions to 436 petitions in the third quarter of 2016 – a number more consistent with the last 2 years of activity.
Fig. 7: CBM and IPR petitions, 2012 – 2016 Q3, by quarter

Trademark Litigation
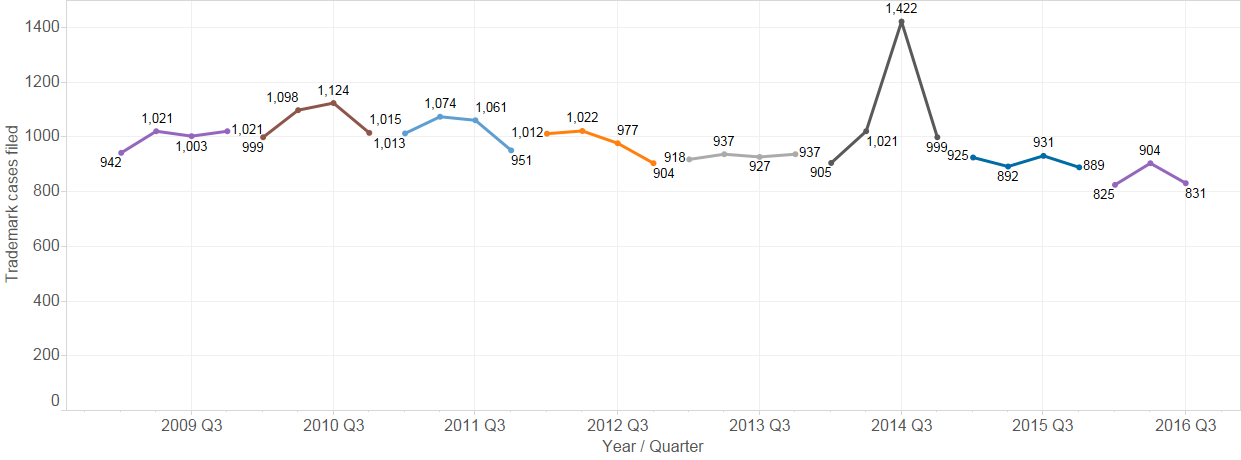
Trademark litigation filing trends have been more predictable than patent trends (or copyright). The filing of new trademark cases has declined at a very slight rate over the last few years, although the third quarter of 2016 (831 cases) represents a slight decrease over the first second (904 cases).
For the curious, the spike in trademark case filings seen below in the third quarter of 2014 was driven by a flood of cases filed in the District of Minnesota against the National Football League, generally by former players over usage of their likeness. These cases account for about 461 of the 1,397 cases filed in Q3 2014. Without these cases, Q3 2014 appears otherwise consistent with the quarters surrounding it.
Fig. 8: Trademark cases filed, 2009 – 2016 Q3, by quarter
Copyright Litigation
Lex Machina divides copyright litigation in the U.S. district courts into two subtypes: file sharing cases (those having John Doe or anonymous defendants and accusations based on file sharing technology such as BitTorrent), and all of the other, more traditional cases. As explained in Lex Machina’s Copyright Litigation Report, these cases follow very different dynamics.
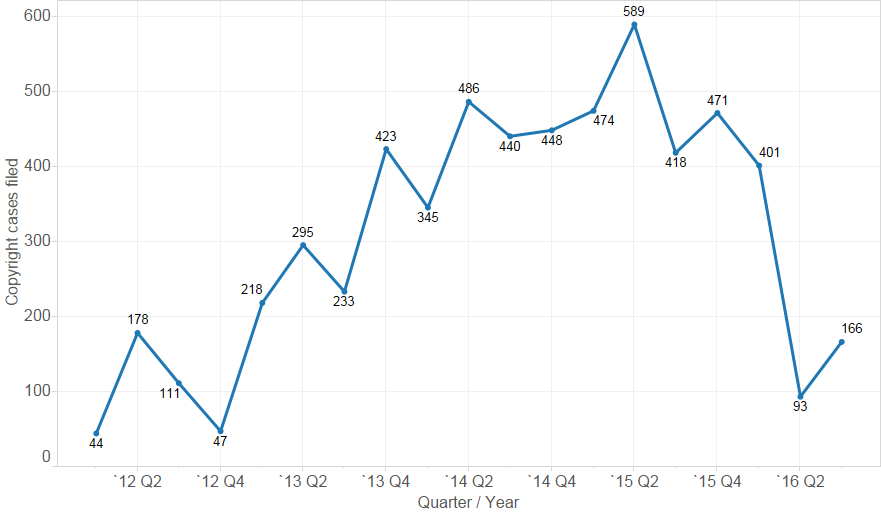
Since its apogee in Q1 of 2015, the number of file sharing cases filed each quarter has declined until reaching a low of 249 cases in Q2 of 2016. The third quarter, however, represents a reversal of this trend, largely due to the increased filings of Malibu Media, the leading file sharing plaintiff (Fig. 10).
Fig. 9: Copyright cases filed, 20011 – 2016 Q3, by quarter
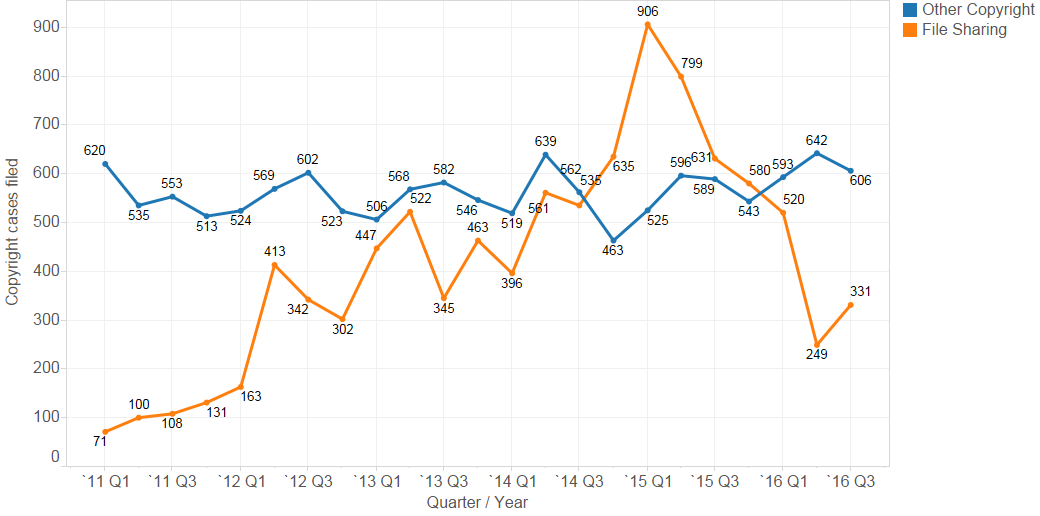
Fig. 10: Copyright cases filed by Malibu Media, 20011 – 2016 Q3, by quarter
Securities Litigation
Lex Machina now offers analytics for securities litigation, as well as intellectual property. For a more complete look at the trends and data available, check out our blog post on the topic.
The third quarter of 2016 represents a high point in the record for new securities case filings not seen since 2009, with 327 new cases in Q3 2016. The average monthly number of new filings since 2011 has been only 245.
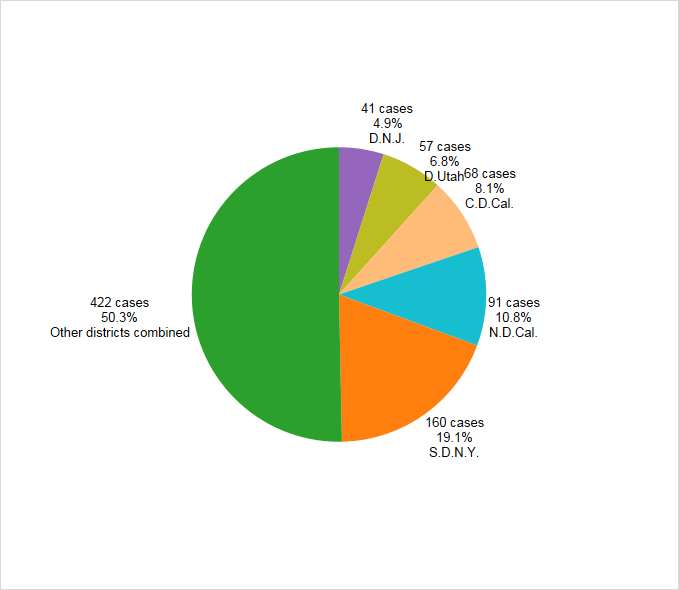
By new cases filed in 2016 through Q3, the Southern District of New York is the leading district, with 19.1% of the cases, followed by the Northern District of California (10.8%) and the Central District of California (8.1%).
Fig. 11: Securities cases filed, 20011 – 2016 Q3, by quarter
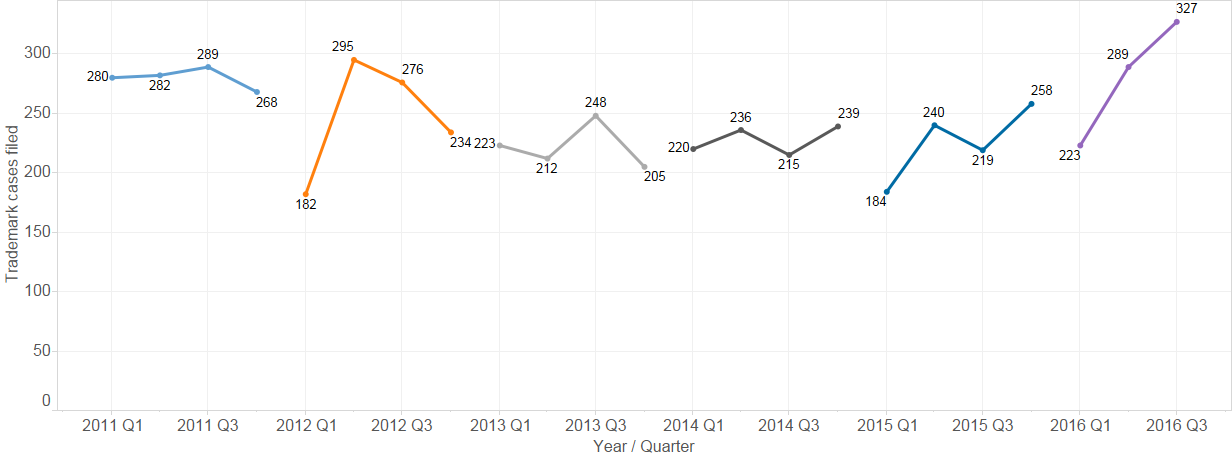
Fig. 12: Top districts by securities cases filed, 2016 Q1-Q3, by quarter